

Application
The disposal bill is a volume bill
Every barrel of oil arrives with three to seven barrels of water, and most of that water is paid to be trucked, piped, or injected away. Concentration takes barrels off that bill and hands water back to the operation.
- Water per barrel of oil, typical
- 3–7bbl
- Membrane concentration ceiling
- 280g/L
- MBC™ energy, vs 25–60 thermal
- 5–12kWh/m³
Most of the cost is transport
Produced water is priced by what it costs to make it someone else's problem: trucking to a disposal well, pipeline capacity, injection fees. All of it scales with volume, and the volume never declines on its own.
- Transport
- Trucking is the dominant cost on leases without water pipelines, and it is paid on every barrel, every day the well produces.
- Disposal capacity
- Injection wells are a constrained resource, and the constraint tightens where regulators link injection volumes to seismicity.
- Freshwater demand
- The same operation that pays to dispose of water pays again to source it for drilling and completions.
The treatment train
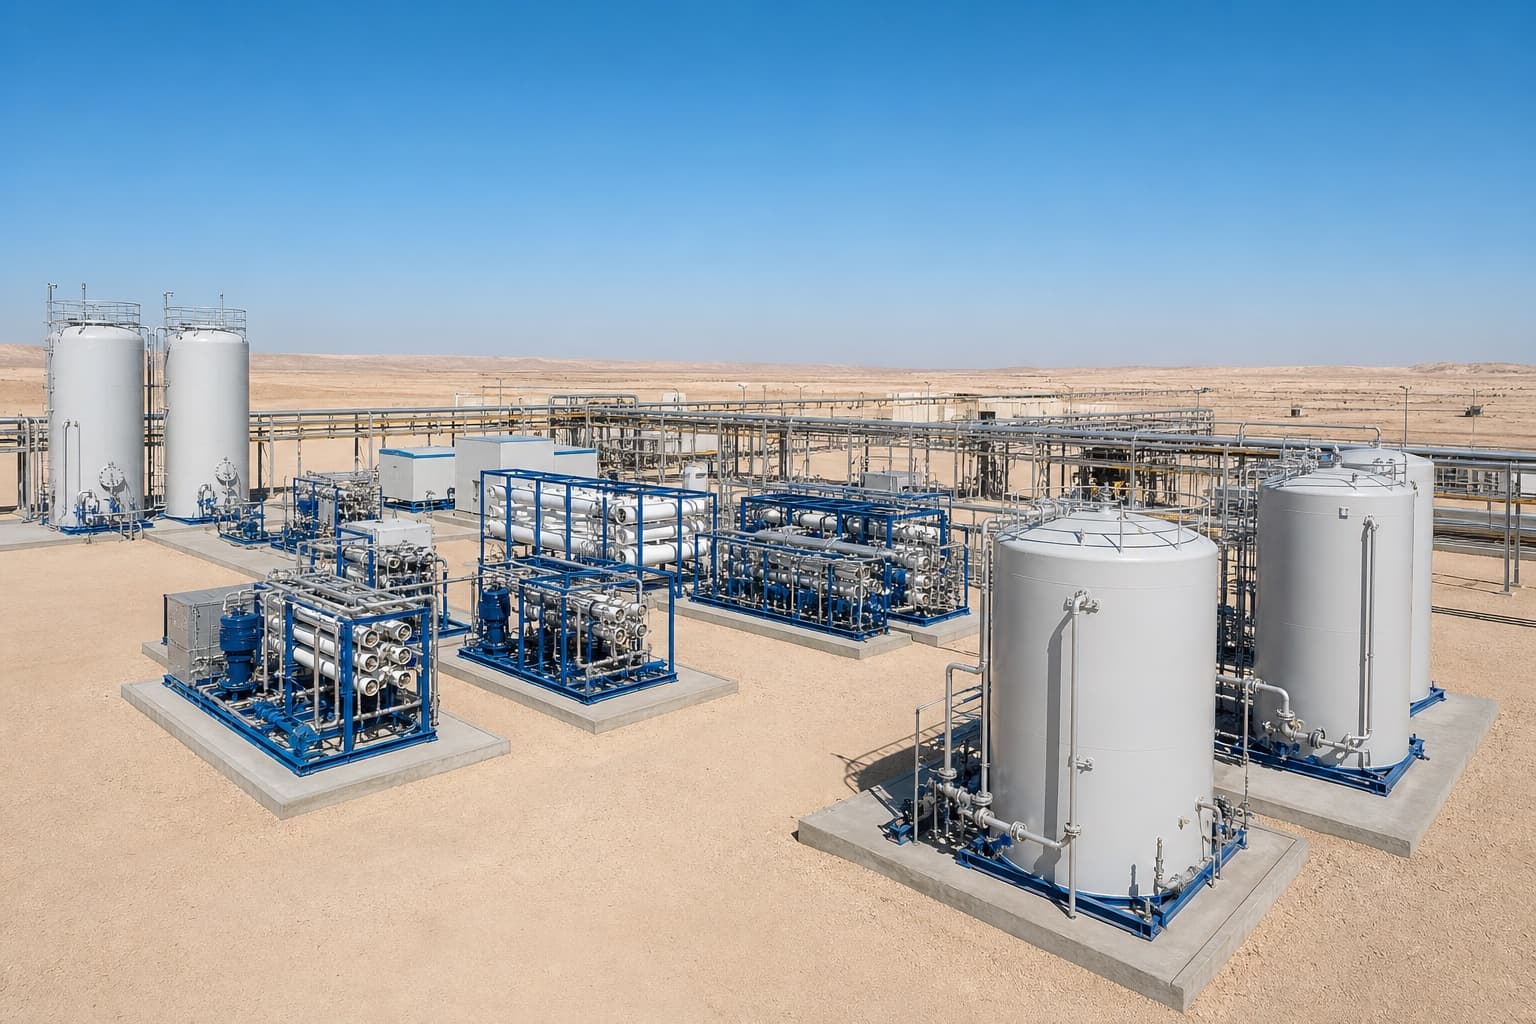
Membrane concentration splits the stream in two: recovered water stays on the lease for reuse, and a concentrate a fraction of the original volume goes wherever the whole stream used to go.
The July 2026 deck's flow sheet for the duty; each project's pilot sets the actual streams.
- 01Produced water50,000–250,000 mg/L TDS
- 02Pretreated feedoil & antiscalant removed
- 03Extracted brineBr₂ · I₂ · SrSO₄ · BaSO₄ taken off
- 04MBC™ concentrate200,000–280,000 mg/L
- 05Recovered waterreuse, injection, or cooling
- 06Industrial saltsNaCl / CaCl₂ at grade
| Stream | Name | Detail |
|---|---|---|
| 1 | Produced water | 50,000–250,000 mg/L TDS |
| 2 | Pretreated feed | oil & antiscalant removed |
| 3 | Extracted brine | Br₂ · I₂ · SrSO₄ · BaSO₄ taken off |
| 4 | MBC™ concentrate | 200,000–280,000 mg/L |
| 5 | Recovered water | reuse, injection, or cooling |
| 6 | Industrial salts | NaCl / CaCl₂ at grade |
Where it pays, and where it does not
The competitor is the cheapest disposal route available to the lease. Sometimes it wins; the feed analysis says so before any capital does.
Where it pays
- Trucked disposal, where cost per barrel is highest
- Rationed injection capacity
- Freshwater purchases within trucking distance of the waste stream
- Brines carrying lithium or minerals worth recovering
Where it does not
- A cheap disposal well at the lease boundary
- Salinity beyond the membrane ceiling - thermal territory
No two produced waters behave alike. The numbers come from a pilot on the actual stream.
Proved on the actual stream
Produced water chemistry changes between wells a kilometer apart, and it changes over the life of each well. Oil carryover, iron, silica, and scaling tendency decide pretreatment; salinity decides which membrane stage carries the duty; the disposal alternative decides whether any of it pays.
That is why the engagement starts with a feed analysis and a pilot on the actual stream, and why the numbers Osmosys commits to are the ones measured there.
A first read on your stream
Send the flow, the chemistry, and the target. A process engineer replies with a first read on recovery, energy, and the train worth piloting.